
NRC Infographics
| Map | Description |
|---|---|
 |
A Typical Boiling-Water Reactor |
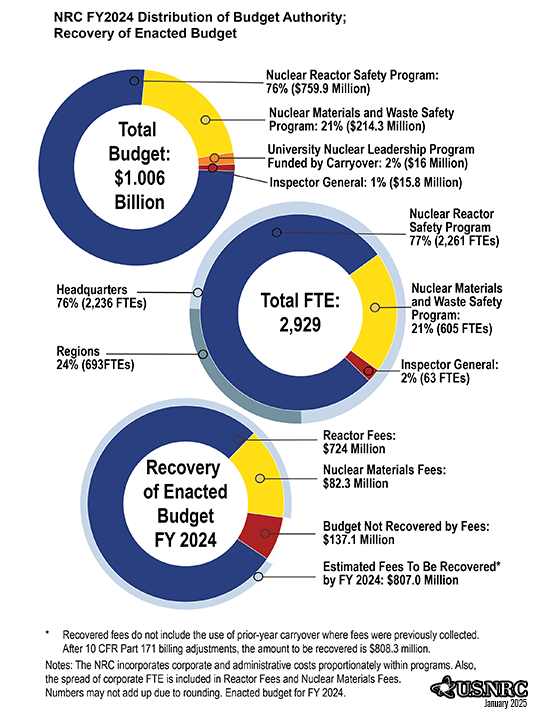 |
NRC FY 2024 Distribution of Enacted Budget Authority; Recovery of NRC Enacted Budget |
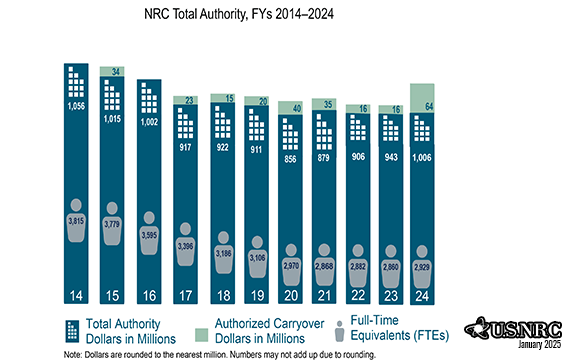 |
NRC Total Authority, FYs 2014-2024 |
 |
NRC Research Funding, FY 2023 |
 |
Commercial Irradiator |
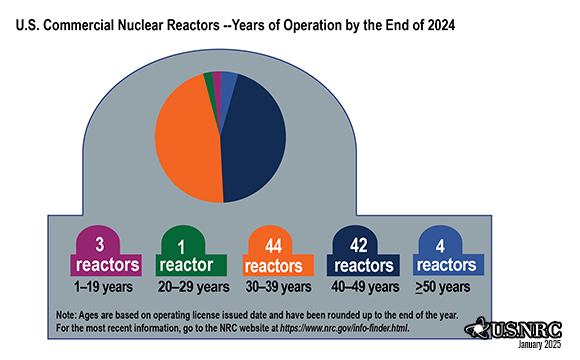 |
U.S. Commercial Nuclear Power Reactors–Years of Operation by the End of 2024 |
 |
Commissioner Term Expiration |
 |
Day in the Life of an NRC Resident Inspector |
 |
Dry Cask Storage |
 |
Dry Storage of Spent Nuclear Fuel |
 |
Emergency Planning Zones |
 |
Fuel Assembly |
 |
Gas Centrifuge Process |
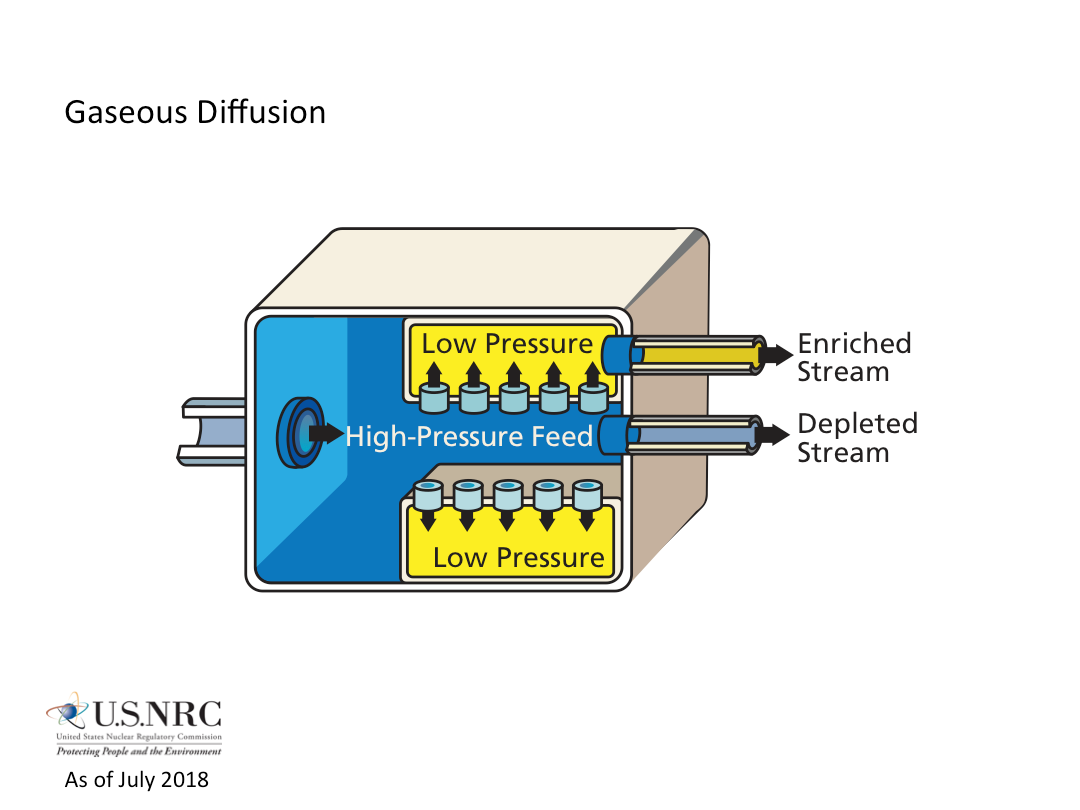 |
Gaseous Diffusion |
 |
Gauging Devices |
 |
Heap Leach Recovery Process |
 |
How We Regulate |
 |
How We Regulate (with text) |
 |
The International Nuclear and Radiological Event Scale |
 |
The In Situ Uranium Recovery Process (with text) |
 |
The In Situ Uranium Recovery Process |
 |
License Renewal Process |
 |
NRC Approach to Source Security |
 |
Low-Level Radioactive Waste Disposal |
 |
Two-Step Licensing Process |
 |
Combined License Application Review Process |
 |
Periodic Table of Elements |
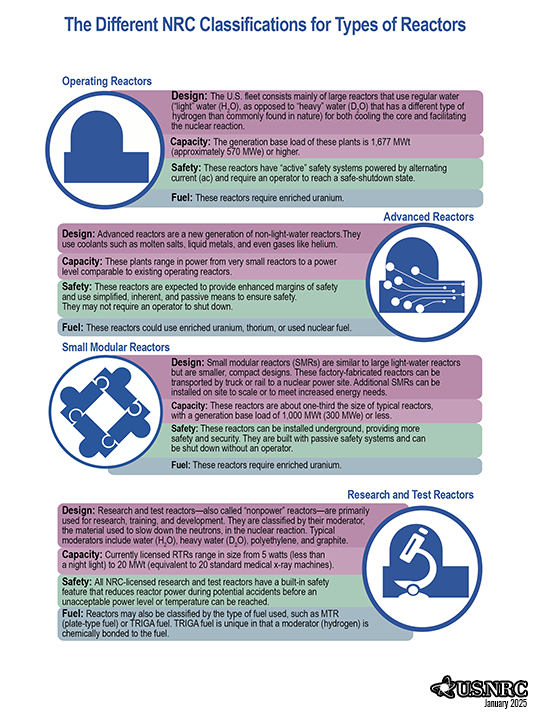 |
The Different NRC Classification for Types of Reactors - (All) |
 |
NRC Organization Chart |
 |
The Nuclear Fuel Cycle |
 |
Nuclear Radiation |
 |
Nuclear Reaction |
 |
Nuclear Share of Electricity Generated by Country |
 |
NRC Post-Fukushima Safety Enhancements |
 |
A Typical Pressurized Water Reactor |
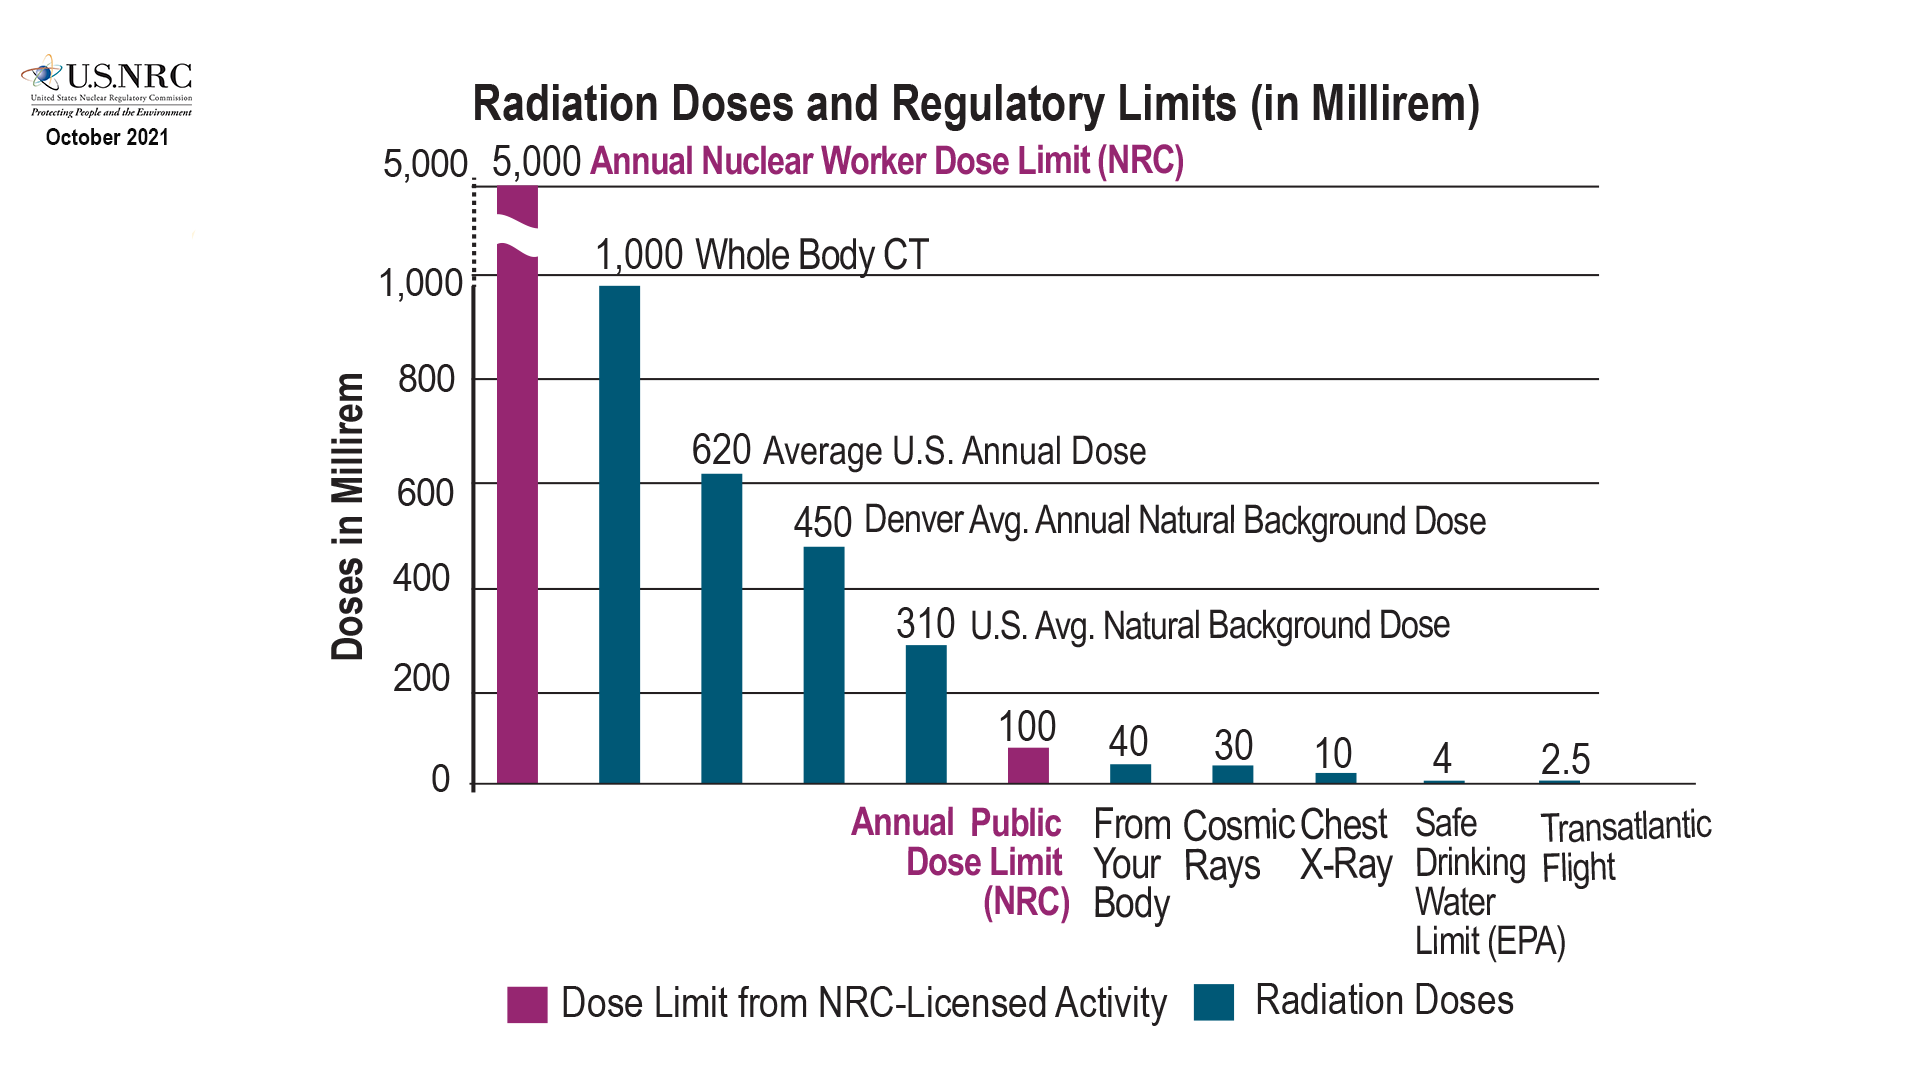 |
Radiation Doses and Regulatory Limits |
 |
Radiation Warning Symbol |
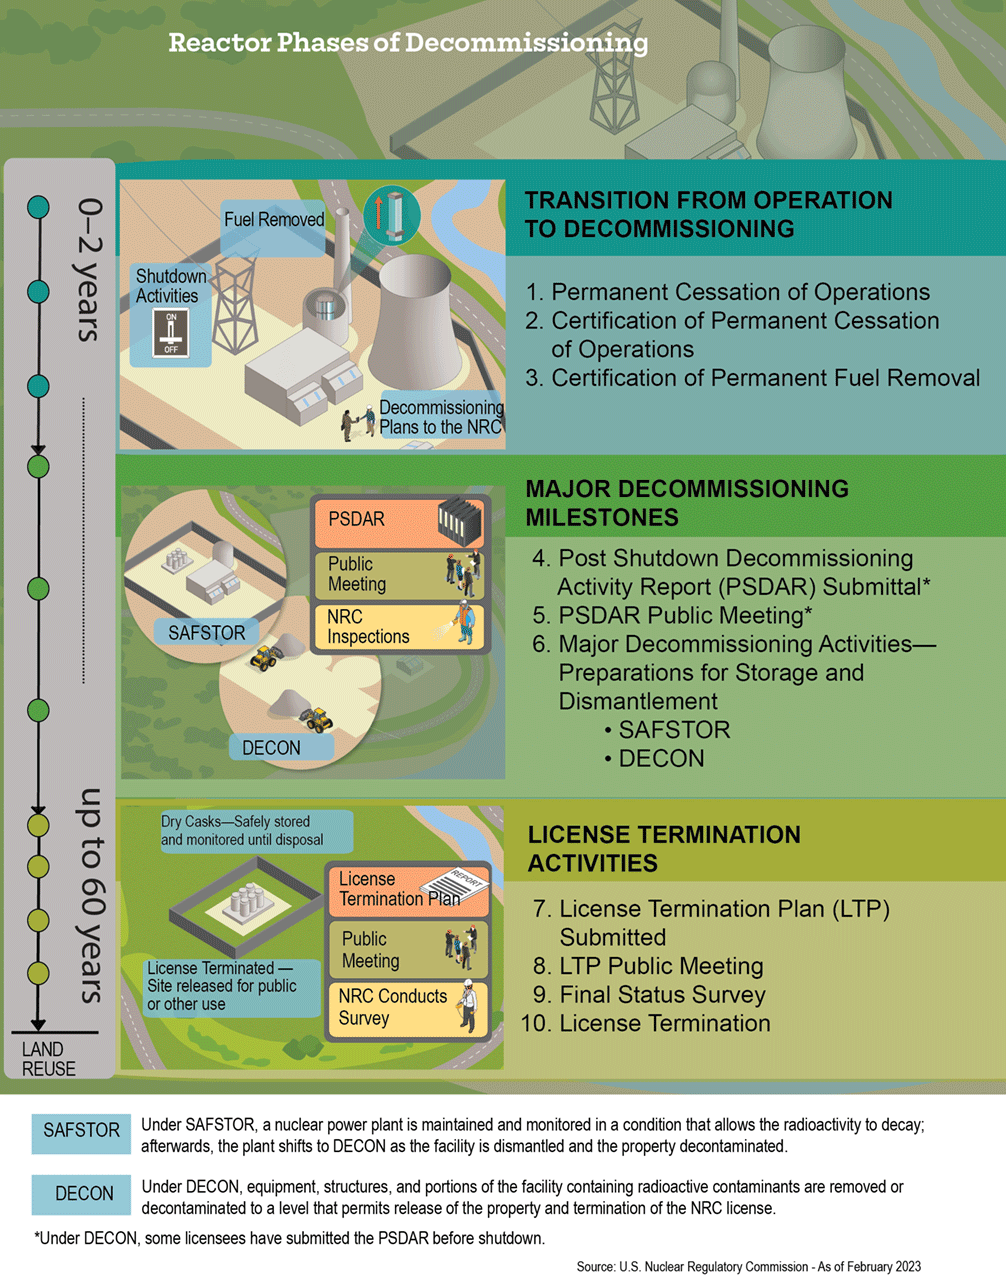 |
Reactor Decommissioning Overview Timeline |
 |
Reactor Oversight Action Matrix Performance Indicators |
 |
Reactor Oversight Framework |
 |
Boiling-Water Reactor Refueling |
 |
Pressurized-Water Reactor Refueling |
 |
Ensuring Safe Spent Fuel Shipping Containers |
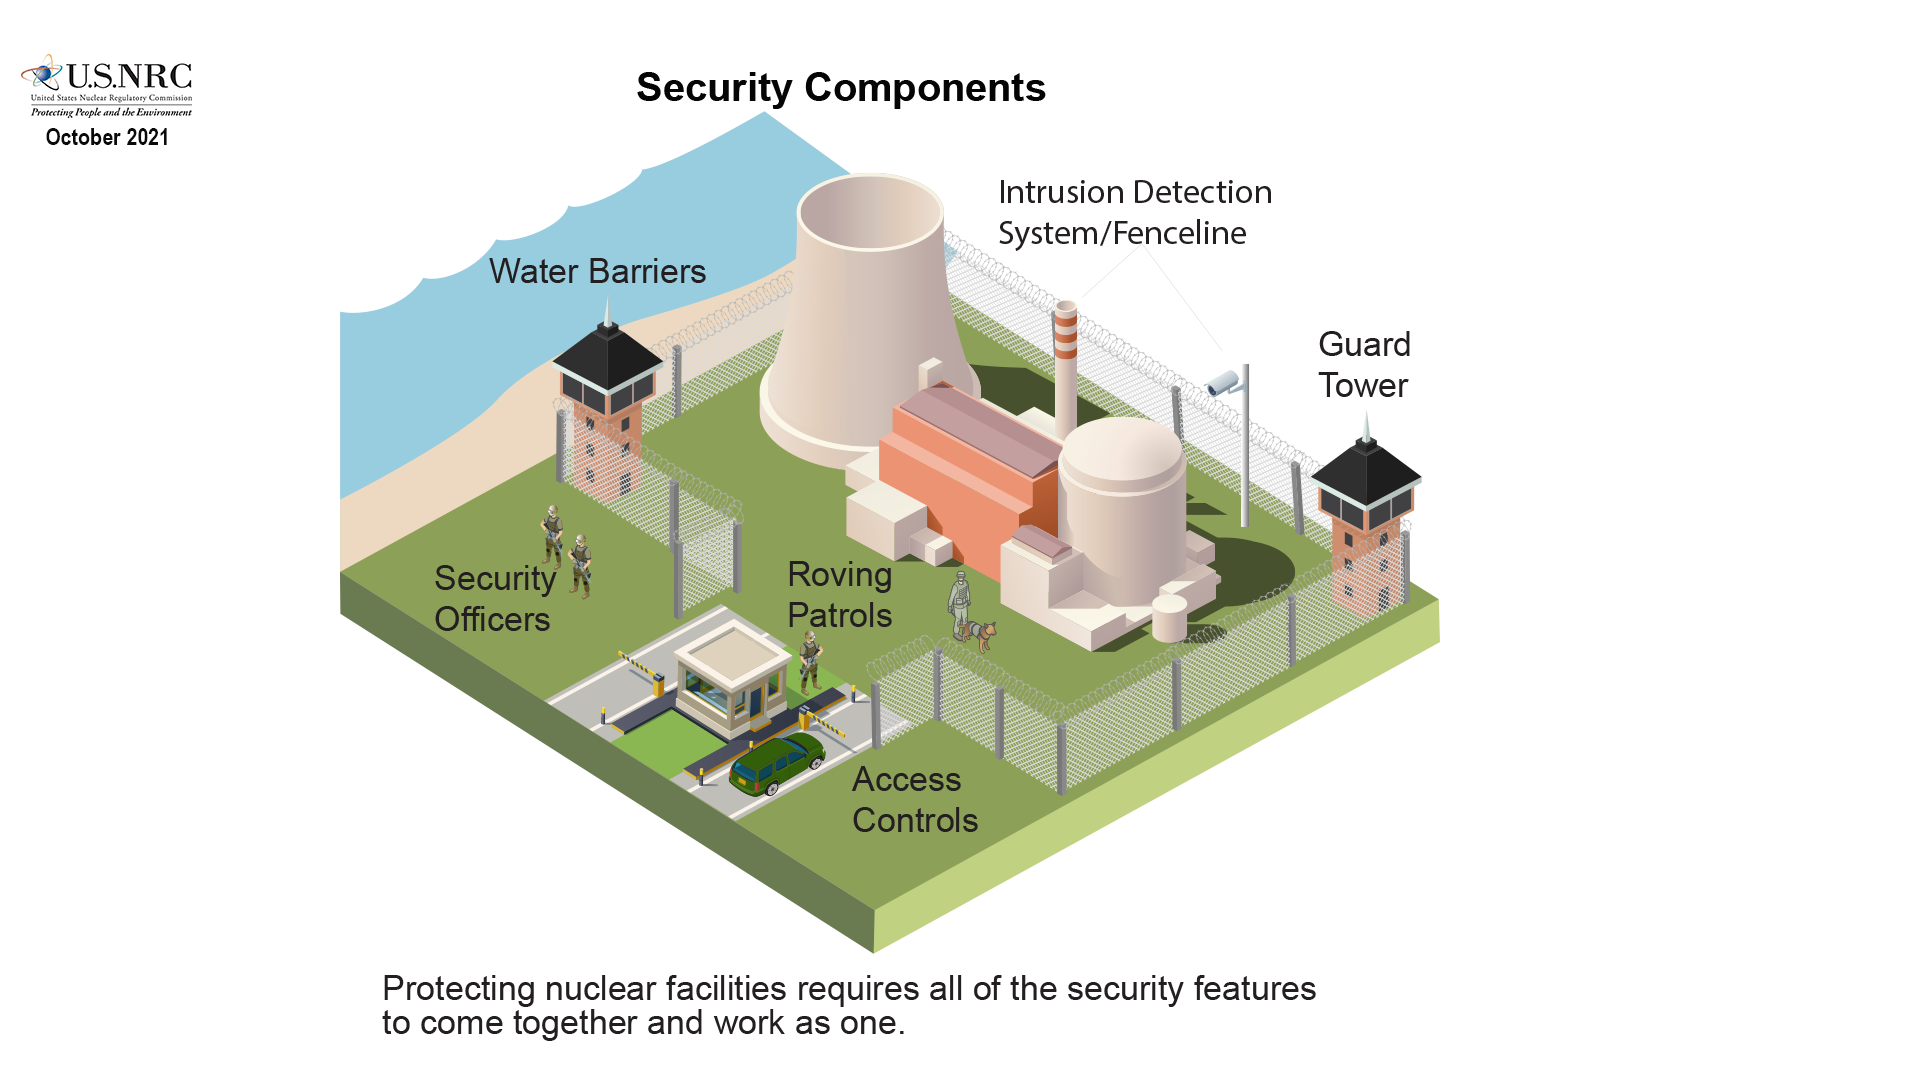 |
Security Components |
 |
Simplified Fuel Fabrication Process |
 |
Size Comparison of Commercial and Research Reactors |
![Illustration diagram of Spent Fuel Generation and Storage After Use, consisting of four images with supporting text: 1 - A nuclear reactor is powered by enriched uranium-235 fuel... (with illustration of a nuclear reactor and a fuel rod assembly; 2 - After 5-6 years, spent fuel assemblies (which are typically 14 feet [4.3 meters] long and which contain nearly 200 fuel rods for PWRs and 80-100 fuel rods for BWRs) are removed from the reactor and allowed to cool in storage pools... (with an illustration of a fuel rod assembly); 3 - Commercial light-water nuclear reactors store spent radioactive fuel in a steel-lined, seismically designed concrete pool under about 40 feet (12.2 meters) of water that provides sheilding from radiation... (with an illustration of a spent fuel pool and a fuel rod assembly). Centered at the top appears the title: Spent Fuel Generation and Storage After Use](/sites/default/files/doc_library/cdn/legacy/reading-rm/doc-collections/infographics/spent-fuel-generation-and-storage-use-all.png) |
Spent Fuel Generation and Storage After Use (All) |
 |
Spent Fuel Generation and Storage After Use (Nuclear Reactor) |
![Illustration diagram of Spent Fuel Generation and Storage After Use, consisting of an image with supporting text: 2 - After 5-6 years, spent fuel assemblies (which are typically 14 feet [4.3 meters] long and which contain nearly 200 fuel rods for PWRs and 80-100 fuel rods for BWRs) are removed from the reactor and allowed to cool in storage pools. At this point, the 900-pound (409-kilogram) assemblies contain only about one-fifth the original amount of uranium-235 (with an illustration of a fuel rod assembly). Centered at the top appears the title: Spent Fuel Generation and Storage After Use](/sites/default/files/doc_library/cdn/legacy/reading-rm/doc-collections/infographics/spent-fuel-generation-and-storage-2.png) |
Spent Fuel Generation and Storage After Use (Fuel Assembly) |
 |
Spent Fuel Generation and Storage After Use (Spent Fuel Pool & Fuel Assembly bundle) |
 |
NRC Rulemaking Process |
 |
Uranium |
 |
U.S. Electric Share and Generation by Energy Source |
 |
The NRC’s Enterprisewide Strategy on Artificial Intelligence |
 |
NRC Licensed Operating Nuclear Reactor Uprates |
Page Last Reviewed/Updated Thursday, March 06, 2025
Page Last Reviewed/Updated Thursday, March 06, 2025